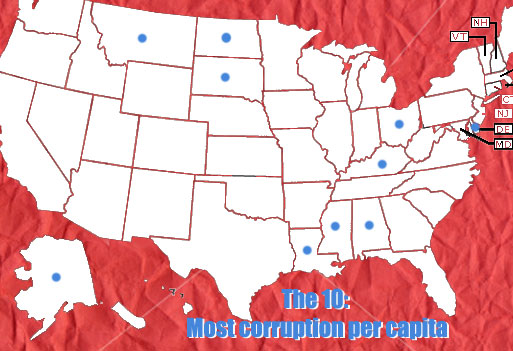
Since corruption has been in the news quite a bit lately, plenty of people have been paying attention to the Department of Justice’s statistics on public corruption.
The New York Times and the USA Today have both run fancy charts based on the corruption stats gathered between 1998 and 2007. Dozens of blogs have been buzzing about the statistics and debates have raged, especially in North Dakota, about whether or not conviction rates really give a particular state a legitimate claim at being either more or less corrupt than another. A third analysis has also been making the rounds based on statistics drawn from the 35 most populace states by Corporate Crime Reporter in 2007.
For many, it came as a shock to see Illinois and New Jersey not crack the top five in any of the charts.
Here are the 10 states with the most corruption convictions per capita. The first number is from the New York Times (per 1 million residents), the second is from the USA Today (per 100,000 residents) and the third is from Corporate Crime Reporter (per 100,000 residents). We took an average of the three, which is in parenthesis.
1. North Dakota, 8.3, 8.3 (8.3)
2. Alaska, 7.9, 7.5 (7.7)
3. Louisiana, 7.5, 7.7, 7.7 (7.6)
4. Mississipi, 7.4, 7.3, 6.66 (7.1)
5. Montana, 6.4, 6.2 (6.3)
6. Kentucky, 5.9, 5.7, 5.18 (5.6)
7. Alabama, 5.6, 5.4, 4.76 (5.3)
8. Delaware, 5.4, 5.1 (5.3)
9. South Dakota, 5.4, 5.1 (5.3)
10. Ohio, 4.8. 4.8, 4.69 (4.8)
Sources: New York Times, USA Today, Corporate Crime Reporter
Leave a Reply